You are on our wealth management services website for advisors & wealth managers.
Browse more Fidelity websites here.
After setting new all-time highs in January, the S&P 500® Index has been declining for several weeks and nearing the threshold of a 10% drop. When major stock indexes fall by 10% or more from their peak, it's typically considered a market correction. Some other indexes, such as the tech-heavy Nasdaq Composite and the Russell 2000 index of small companies, have already crossed into correction territory in recent days.
Corrections can occur for a variety of reasons. The market's recent pullback has been driven by concerns around disruptions to global energy markets posed by the conflict in the Middle East, and how these disruptions may impact growth and inflation.
With a correction at hand, it may be time to brush up on what corrections have typically looked like, and what investors may want to consider.
While corrections can be unnerving, they have historically been a normal part of investing.
Since 1980, the S&P 500 has experienced a drop of 5% or more in 93% of calendar years, and has experienced a drop of 10% or more in 48% of calendar years.
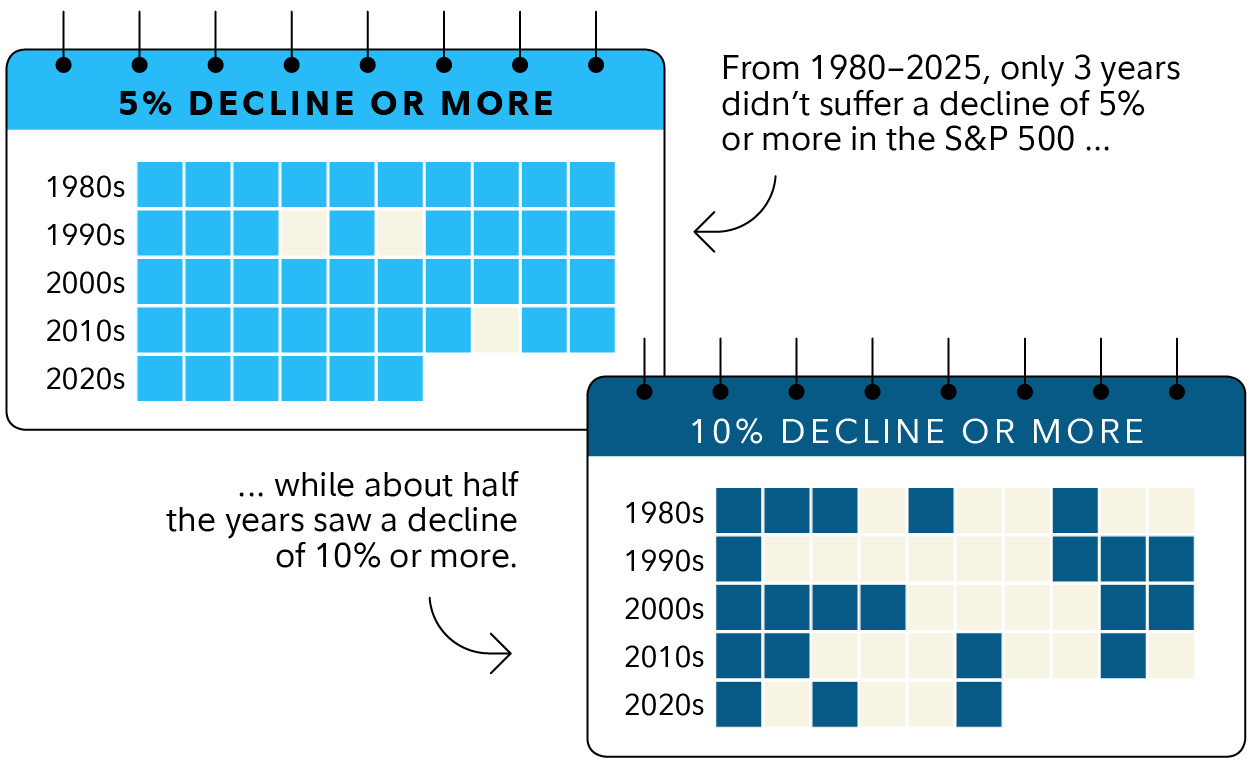
Past performance is no guarantee of future results. Biggest drop refers to the largest drop from a peak to a trough in the S&P 500 during each calendar year. Data as of December 31, 2025. Sources: Standard & Poor's, Bloomberg Finance L.P., Fidelity Investments.
Despite those frequent declines, the market’s average calendar-year return over the same period has been 13.3%.
It's impossible to know how long it may take for stocks to recover their previous highs and for volatility to subside, due to the inherent unpredictability of future events.
But historically, the market has typically recovered quickly from corrections. The chart below shows the largest drop from a market high in each year (red dots). You can see that it’s not uncommon to experience significant market declines. But the market still has often recovered and produced positive results in most years (shown as the green bars).
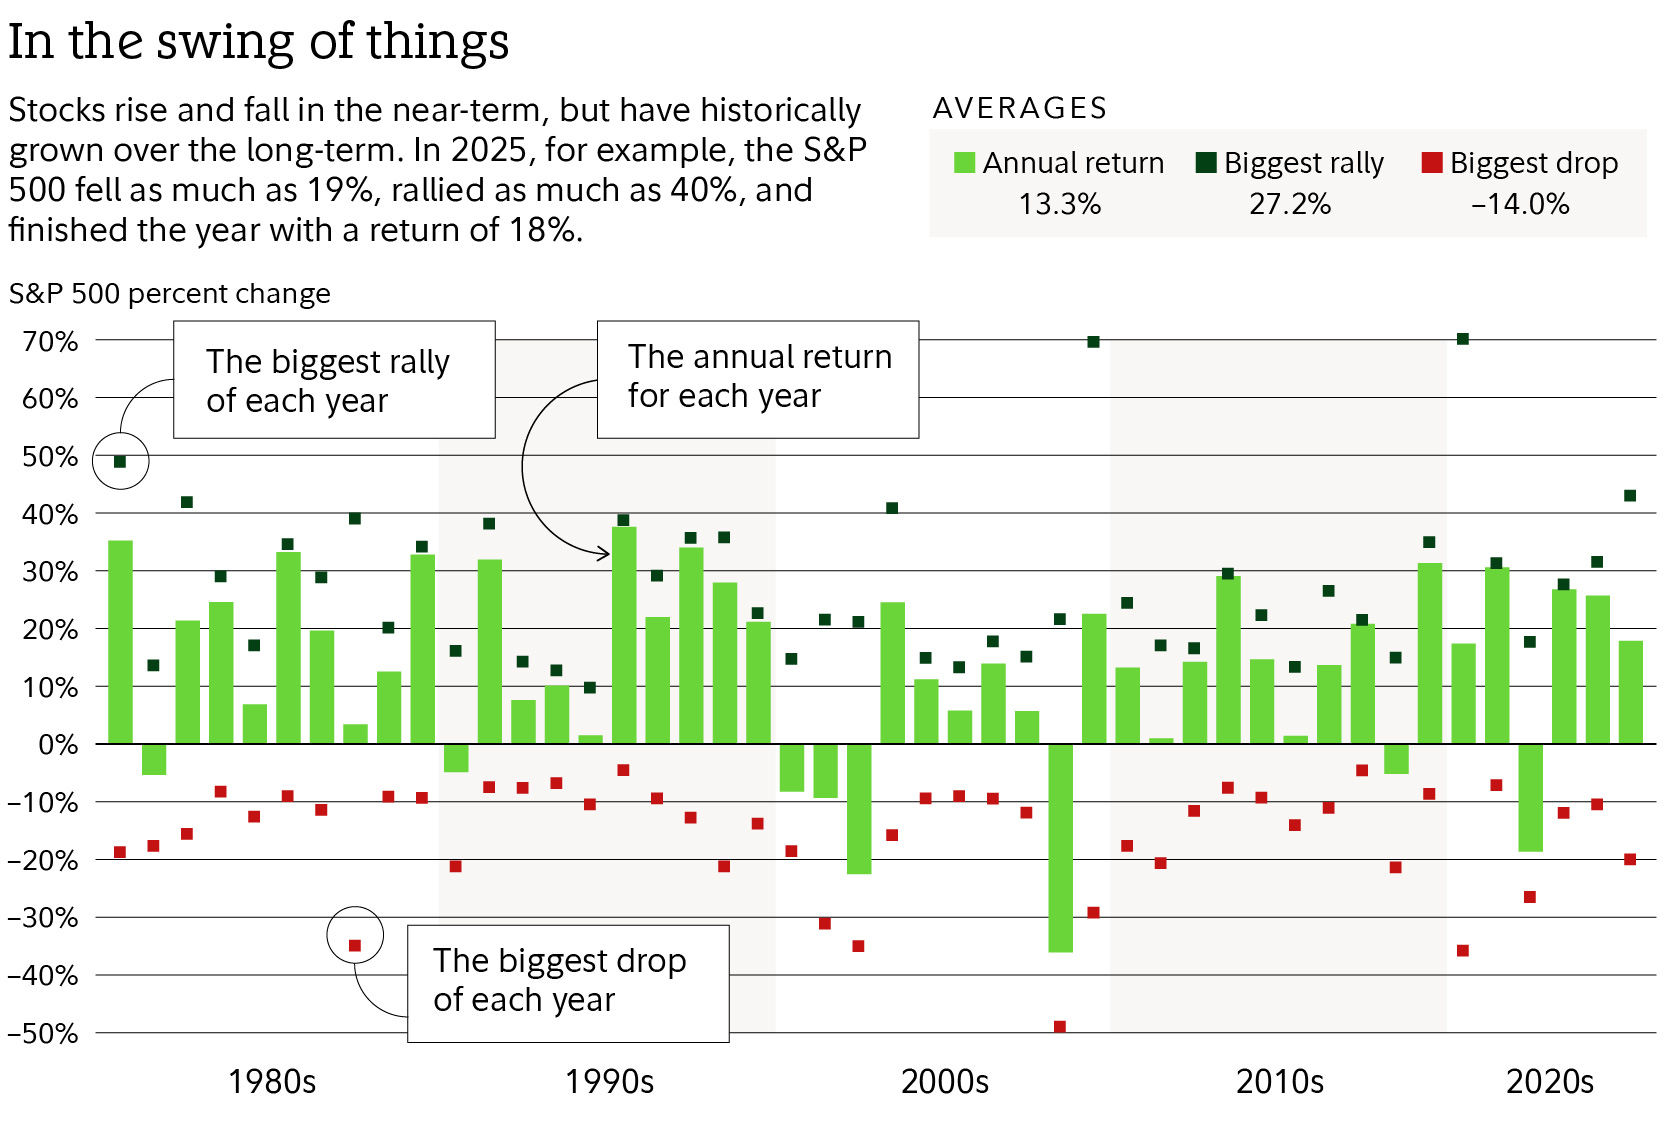
Past performance is no guarantee of future results. Returns are based on index price appreciation and dividends. Indexes are unmanaged. It is not possible to invest directly in an index. Biggest drop refers to the largest index drop from a peak to a trough during each calendar year. Biggest rally refers to the largest index gain from a trough to a peak during each calendar year. Data as of December 31, 2025. Sources: Standard & Poor’s, Bloomberg Finance L.P., Fidelity Investments.
“Since 1980, the S&P 500 Index has experienced a decline of about −14% on average in any given calendar year,” says Naveen Malwal, institutional portfolio manager with Strategic Advisers, LLC, the investment manager for many of Fidelity’s managed accounts. “Yet stocks have normally recovered and finished with average gains of about 13% in any given calendar year, including dividends. So a market decline of −10% or −15% isn’t unusual, nor necessarily a sign that stocks will continue to decline. Market volatility can feel unsettling, but it is normal.”
Anytime the market enters a pullback, some investors start to worry that “this time is different.” In the midst of uncertainty, it’s natural to fear the worst. Yet investors should remember that historically the U.S. economy and stock market have again and again surmounted steep obstacles—including pandemics, recessions, market bubbles, and even a depression—and eventually gone on to thrive.
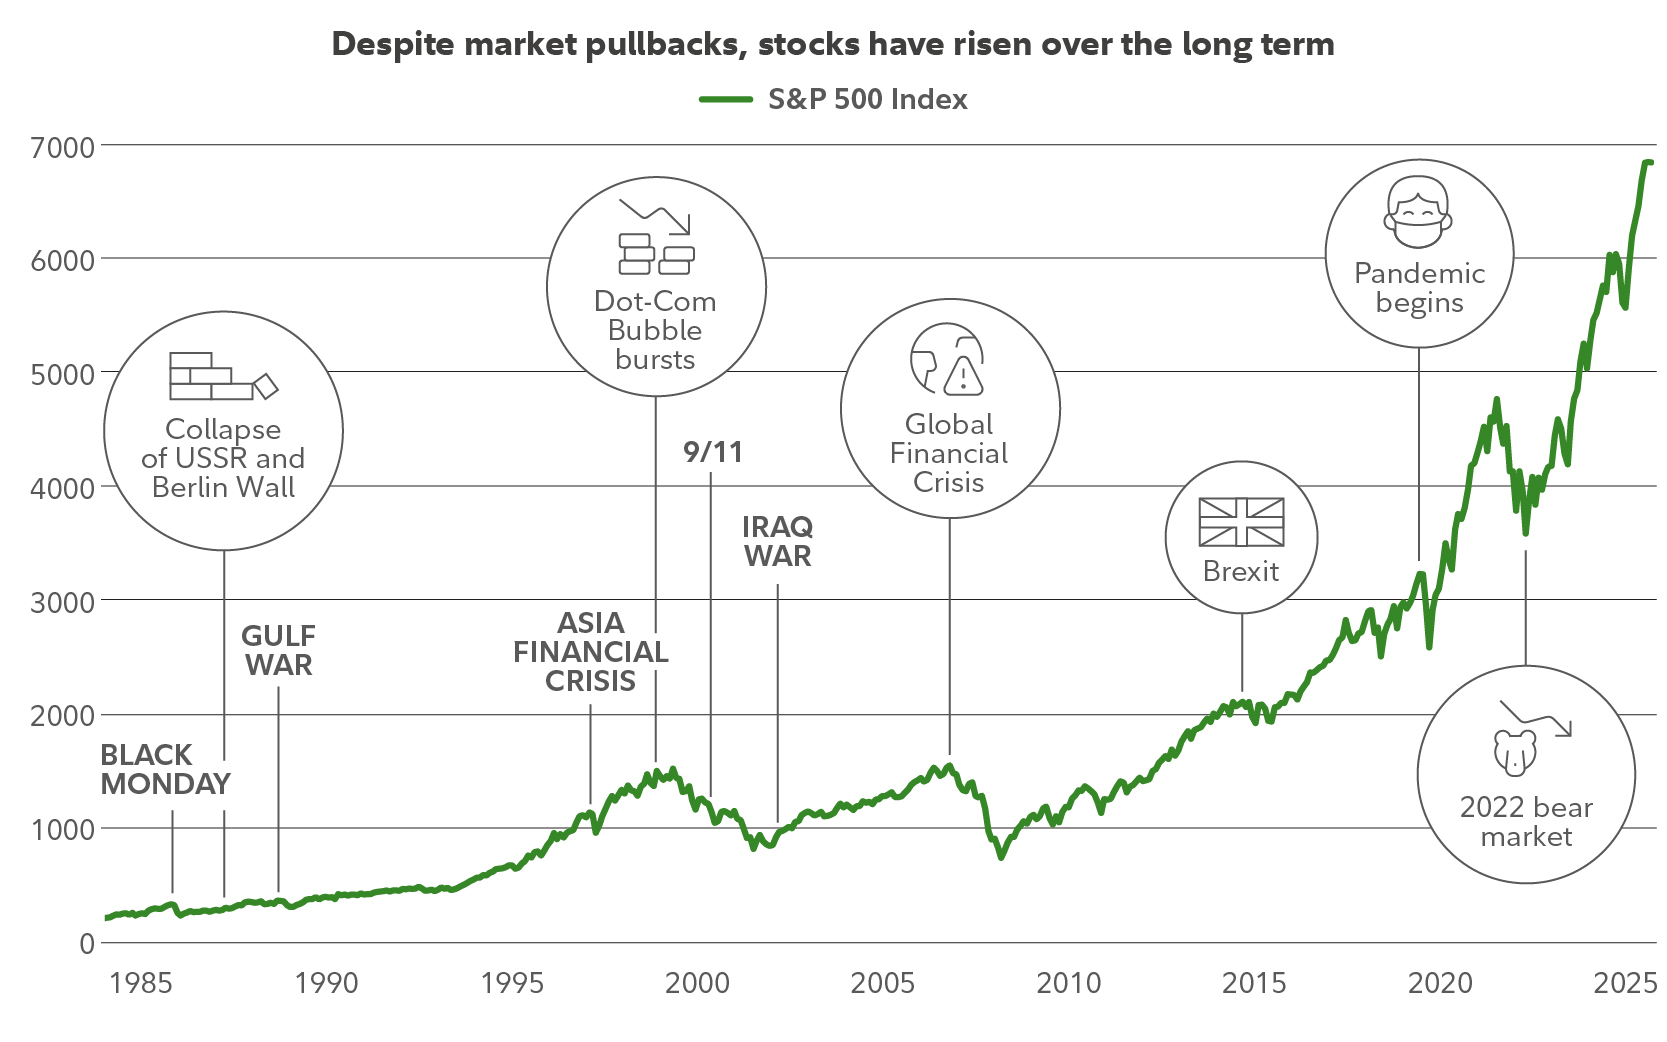
Past performance is no guarantee of future returns. Source: FMRCo, Bloomberg, Haver Analytics, FactSet. Data as of December 31, 2025.1 The S&P 500 Index is a market capitalization–weighted index of 500 common stocks chosen for market size, liquidity, and industry group representation. S&P and S&P 500 are registered service marks of Standard & Poor's Financial Services LLC. You cannot invest directly in an index.
“It may also help to remember that markets can react to news headlines and emotions in the short term,” says Malwal. “But over the long run, stocks have usually risen if corporate profits are growing.”
Jake Weinstein, senior vice president on Fidelity's Asset Allocation Research Team, adds that the US economy still appears to be in the middle of an economic expansion rather than in, or on the cusp of, a recession. "Have risks increased? Yes," Weinstein says. But the increases seen in energy prices thus far may be unlikely to single-handedly derail the U.S. economic expansion. "Overall, the U.S. economy is very well diversified and seems to be in a pretty good spot."
While it can take nerves of steel not to react when stocks are falling, this has often been the best course of action. Investors who sell, in an attempt to head off further losses, risk locking in potential losses and often miss out on the market’s subsequent recovery.
Here’s how to think about your potentially best course of action.
If an investor is saving for retirement or another goal that is years away, the time to consider how much of a loss they can handle isn't during a correction. Rather, the investor should consider the appropriate risk level for their portfolio when they are looking at their long-term goals, and thinking clearly about their financial situation and emotional reaction to risk.
If an investor hasn't created a plan, it is recommended that they should. If an investor does have a plan, it may be worth checking in to see if their investments are still in line with that plan and if the plan continues to reflect their investment horizon, financial situation, and risk tolerance. If all that is so, an investor will likely be in a better position to manage the ups and downs of the market. If an investor's mix of investments is off track, consider rebalancing back to a more neutral positioning.
For retirees who may be relying on their investment portfolio for a portion of their income, a market drop can present a different kind of challenge. If an investor has an income plan that is built to withstand different market conditions, they really don't need to react to a short-term market move. If not, it may be a good time to sit down with a financial professional to discuss their strategy.
While we don't know if any pullback will be short-lived or the beginning of a bigger downturn, history shows that the stock market recovers from downturns, and most sound investment strategies are built to withstand volatility, even sharp pullbacks.
Access economic, fundamental, and quantitative analysis from our Asset Allocation Research Team.
Learn more
Manage client portfolios with greater efficiency and impact with our broad universe of portfolio construction solutions and investment products.
Learn more
Browse through powerful insights and resources from one of the largest money market mutual fund providers in the industry.
Learn more
Views expressed are as of the date indicated, based on the information available at that time, and may change based on market or other conditions. Unless otherwise noted, the opinions provided are those of the speaker or author and not necessarily those of Fidelity Investments or its affiliates. Fidelity does not assume any duty to update any of the information.
Investing involves risk, including risk of loss.
Past performance and dividend rates are historical and do not guarantee future results.
Diversification and asset allocation do not ensure a profit or guarantee against loss.
Stock markets are volatile and can fluctuate significantly in response to company, industry, political, regulatory, market, or economic developments. Investing in stock involves risks, including the loss of principal.
The S&P 500® Index is a market capitalization-weighted index of 500 common stocks chosen for market size, liquidity, and industry group representation to represent US equity performance.
Indexes are unmanaged. It is not possible to invest directly in an index.
Strategic Advisers LLC (Strategic Advisers) is a registered investment adviser and a Fidelity Investments company.
Fidelity Investments® provides investment products through Fidelity Distributors Company LLC; clearing, custody, or other brokerage services through National Financial Services LLC or Fidelity Brokerage Services LLC; and institutional advisory services through Fidelity Institutional Wealth Adviser LLC.