You are on our wealth management services website for advisors & wealth managers.
Browse more Fidelity websites here.
When geopolitics heats up, as we’ve seen in the past 2 weeks, investors understandably start searching for the “right” way to react in their portfolios: Should you move some money to cash? Chase energy stocks? Load up on defensive sectors?
The last few weeks have delivered plenty of headline risk, but beneath the surface the market’s message is more nuanced—and, in some ways, surprisingly constructive.
Below are 5 of the most surprising takeaways in the market data right now, plus 1 quiet positive that headlines are masking.
It’s easy to call this market complacent. US stocks are coming off 3 consecutive calendar years of above-average returns—despite plenty of macro risks—and valuation measures like price-earnings ratios (P/Es) are above their long-term averages.
But beneath the surface the data shows the opposite. Stock investors are highly fearful, with the VIX (Volatility Index) spiking to top-decile levels since the start of the Middle East conflict. Valuation spreads—another measure of investor fear, which compares P/E ratios of the highest-valued stocks against those of the lowest-valued stocks—have been pinned in their top decile.
Those are classic markers of stock-market anxiety. The bond market, meanwhile, isn’t flashing the same level of stress. There, the key metric to watch is credit spreads—meaning, the additional yield that investors demand in exchange for taking on default risk. Credit spreads have widened since the start of the conflict, but from low starting points, and they remain far from “distress” territory. This matters because the bond market has often been the more predictive market, historically. Stocks tend to react first and ask questions later, while the credit market may keep a cooler head.
That mismatch—stocks showing fear, but corporate bonds not alarmed—is precisely the backdrop in which stocks have often climbed the wall of worry. In other words, a lot of the bad news investors fear may already be priced in.
History is remarkably consistent on this point: When lining up major geopolitical events, from Pearl Harbor to the start of the Russia‑Ukraine War, and look at the subsequent 12 months, average stock market returns are right around their long‑run trend—about 8%.
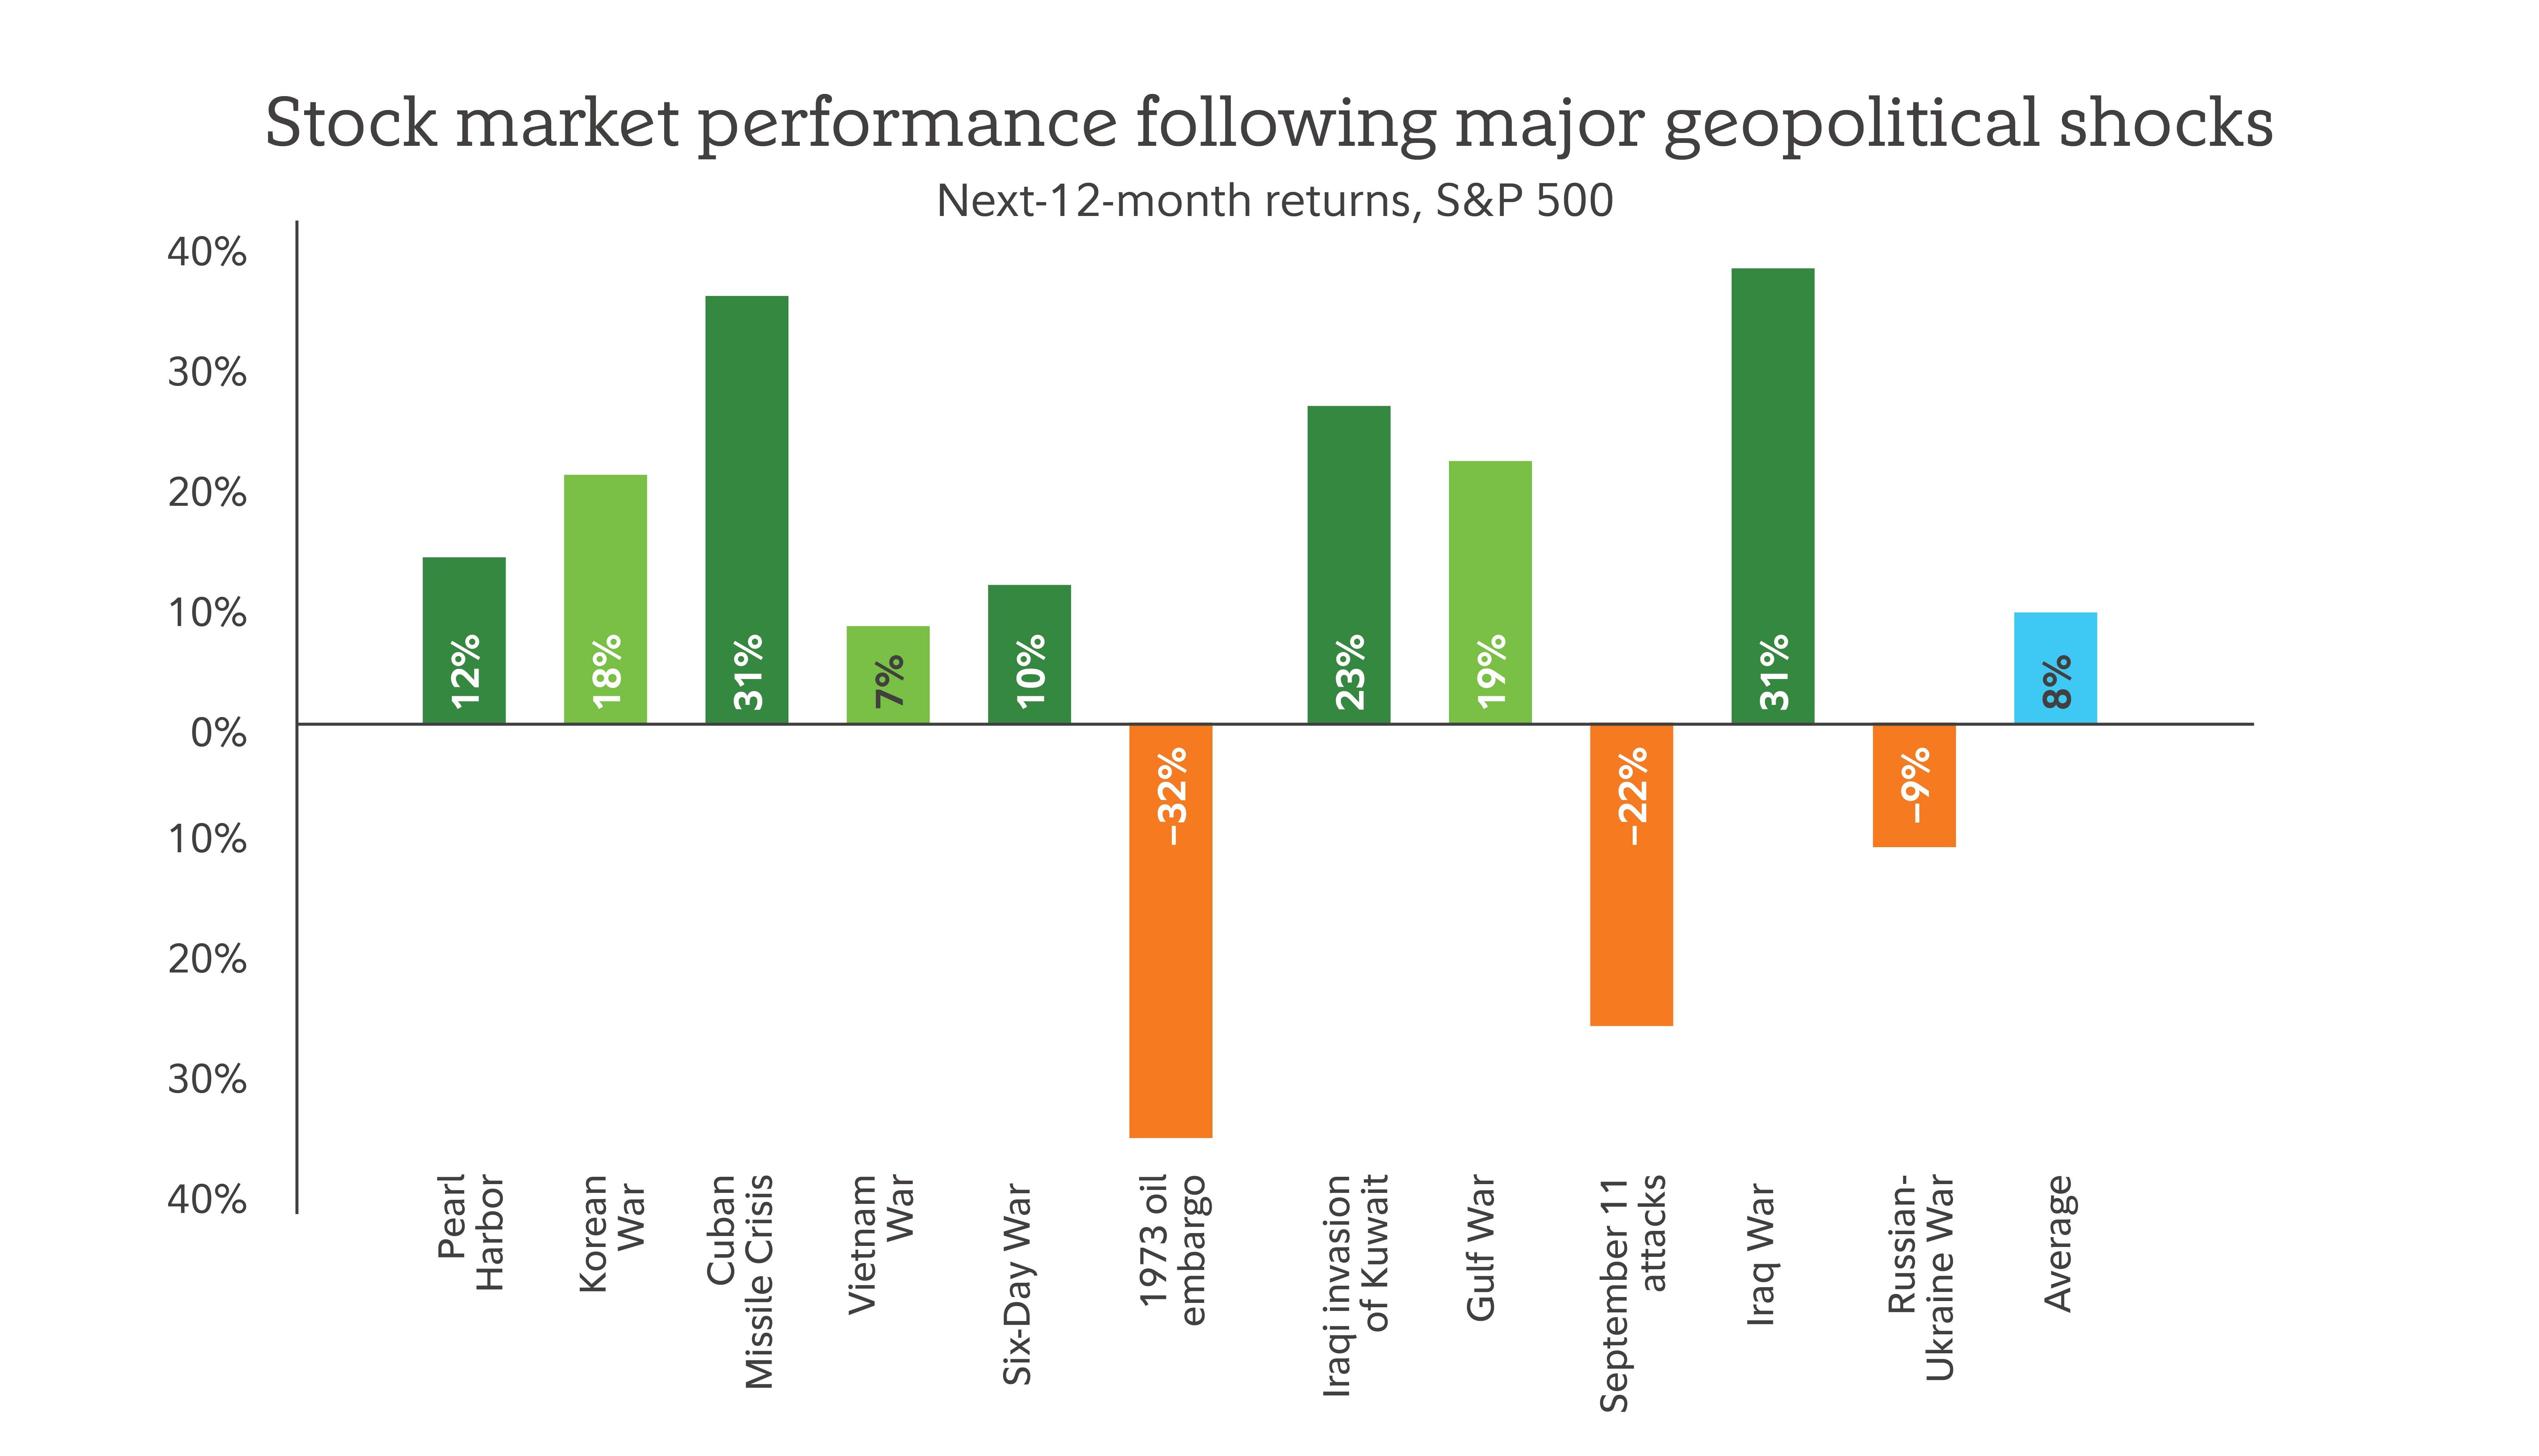
Past performance is no guarantee of future results. All indexes are unmanaged, and performance of the indexes includes reinvestment of dividends and interest income, unless otherwise noted. Indexes are not illustrative of any particular investment, and it is not possible to invest directly in an index. Data as of March 2, 2026. Sources: Haver Analytics, Fidelity Investments.
It’s the exception, not the rule, for conflicts to produce sustained market headwinds.
When geopolitics has mattered to markets, it’s often been due to impacts on energy prices. As the chart above shows, the 1973 oil embargo stands out among geopolitical shocks in modern history, for having the most significant negative impact on subsequent market returns.
But today’s energy landscape is very different from that of the 1970s. First, the global energy market is much less dependent on oil from the Middle East than it was in the 1970s, when the Organization of the Petroleum Exporting Countries (OPEC) held more market share. Today, countries in the Organization for Economic Cooperation and Development (OECD) produce nearly as much oil as OPEC, in no small part due to US shale production. And since 2020, for the first time in modern history, the US has been a net exporter of crude oil, rather than a net importer.
Second, US households spend a much smaller portion of their income on energy than they did in the 1970s—about 3% today, versus 8% to 9% in the 1970s. That means even a similar percentage rise in the price of oil would eat less into consumers’ incomes and put less of a dent in the overall US economy.
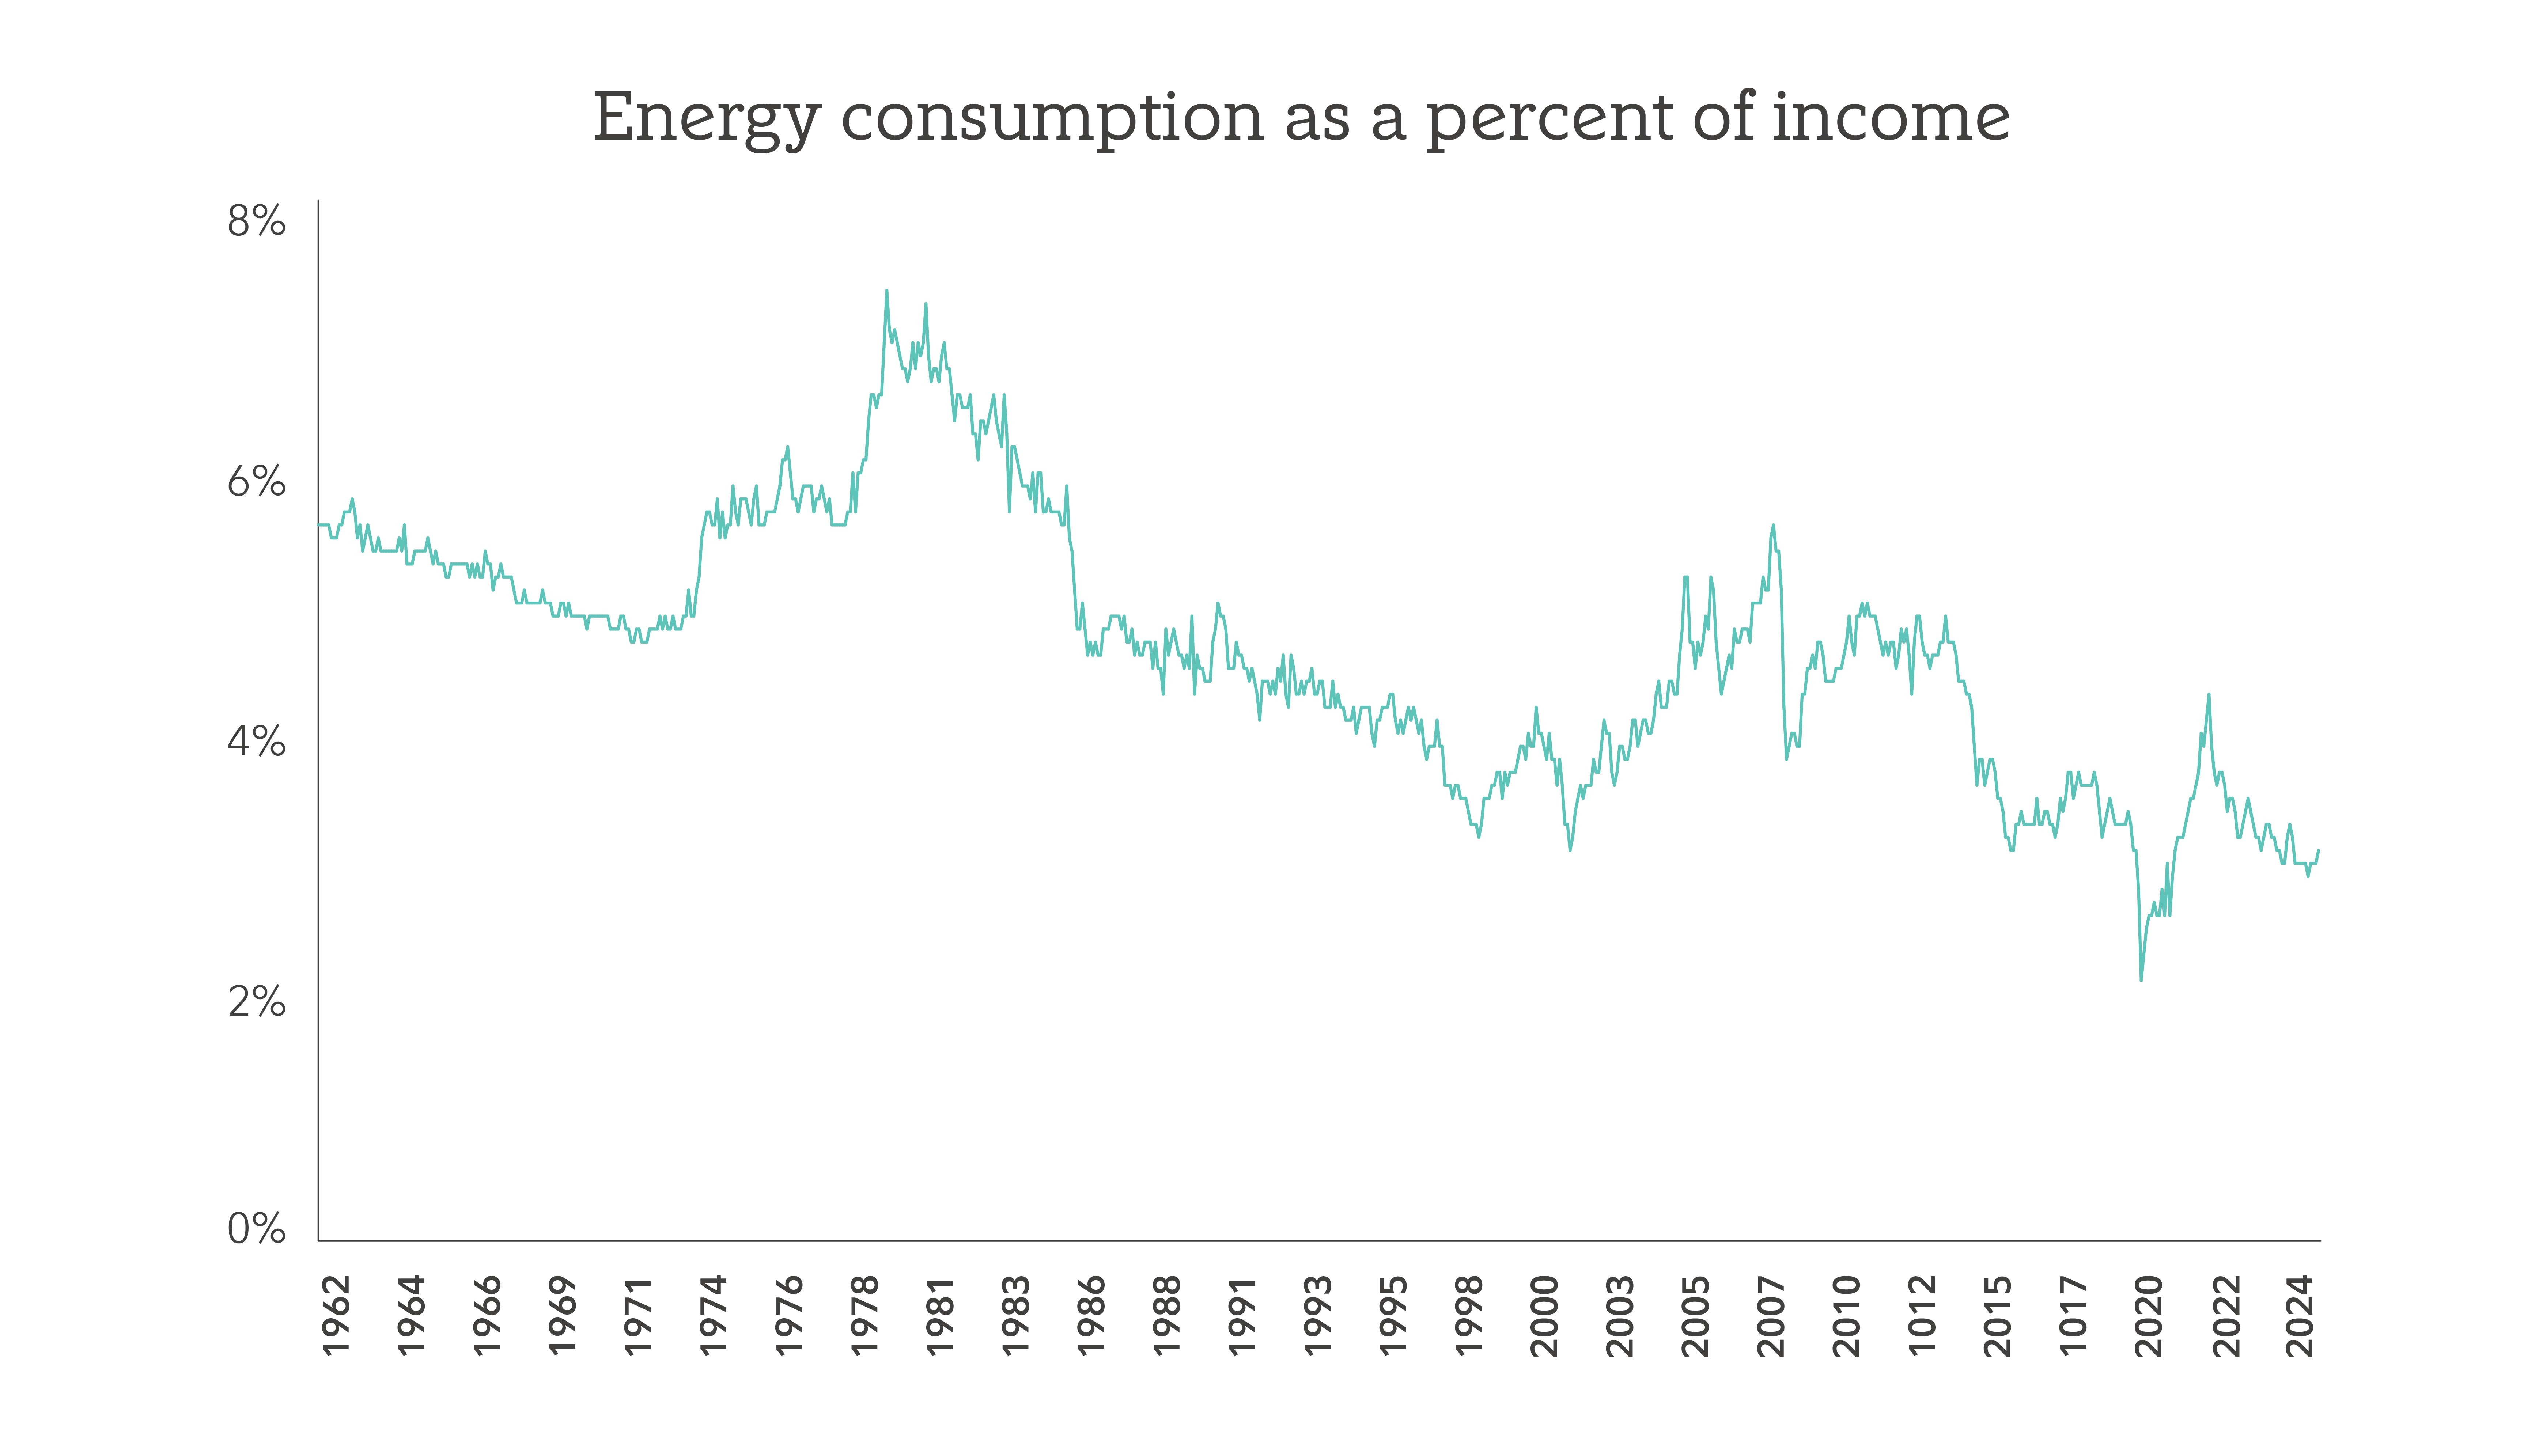
US household personal incomes and US household energy expense based on the Personal Consumption Expenditures Index. Data as of March 2, 2026. Sources: Haver Analytics, Fidelity Investments.
Of course, if any rise in oil prices were steep enough, it could eventually cause economic damage. Historically, there’s been a line in the sand around the 5% level—once consumers have to spend about 5% or more of their incomes on energy, they will start tightening their purse strings. By my math, that threshold would correspond to energy prices around $135 to $145 a barrel, which is still meaningfully higher than recent trading levels. And prices would likely need to remain elevated for weeks or even months in order to create a sustained headwind for consumers.
In other words, it may take a bigger shock than investors realize for high oil prices to trigger a recession.
When focusing only on the headlines, it may seem like a foregone conclusion that energy prices will keep rising from here. Reports suggest traffic in the Strait of Hormuz has slowed significantly. Some Middle East energy-producing nations have seen energy infrastructure attacked or have had to curtail production because they cannot ship oil out and have no place to store it.
No one can predict exactly how these events will unfold. But history shows that after past shocks that moved oil prices, oil has been more likely to be lower—not higher—a year later.1
One possible explanation for this trend is that often, markets price in geopolitical risks in advance (in this case, the price of oil had already been creeping up in the 2 months prior to the start of the Iran conflict). Another is that high prices can themselves cure high prices. In other words, if the price of oil gets high enough, the market may find a way to get more oil to market or a policy solution might be found.
This is not to say that I’m betting oil will fall from here. Short-term moves are extremely unpredictable, and whipsaw potential is high. But don’t be surprised if oil is cheaper a year from now than it is today.
Investors might have expected energy stocks to surge as recent events unfolded. While energy did outperform the S&P 500® in the week following the start of the conflict, it was only by a modest margin. Instead, the real breakout performance came from software, which was the top-performing industry in that period (with the broader tech sector only slightly behind energy).
That’s consistent with what my quantitative research has been signaling. Relative valuations for the tech sector (meaning the sector’s average P/E ratio compared with the broader market’s average P/E ratio) have fallen to roughly the bottom third of their historical range. When that’s happened in the past, the sector has gone on to outperform about 70% of the time. This dislocation has been particularly pronounced in software, where operating profit margins have been near peak levels, yet relative valuations have reached as low as 14th-percentile levels.
Investors seem to be concerned that artificial intelligence (AI) may pose an existential threat to certain tech companies, and particularly software companies. While some companies may indeed become obsolete, many more may adapt, reinvent, and find new ways of adding value. And we think recent valuations provide a healthy margin of safety—against threats from both AI and from economic risks potentially posed by high energy prices.
One final point to keep in mind: Bad news tends to command more space in the headlines, and in investors’ minds, than good news. But focusing too much on the bad can lead investors to miss out on market gains if the positives end up driving the market higher.
Right now, one of the most important offsets may be the quiet improvement in US manufacturing, where the latest data from the manufacturing purchasing managers index showed back-to-back months of expansion and early signs of a potentially durable inflection.2 After several years of slow, slogging malaise in US productive capacity, an inflection could support the overall economy and earnings growth.
If the underlying improvement proves durable, the market may end up telling a very different story than recent headlines might suggest.
Take your portfolio strategies to the next level with our flexible, innovative portfolio construction and management tool.
Learn more
Manage client portfolios with greater efficiency and impact with our broad universe of portfolio construction solutions and investment products.
Learn more


1. Based on the price at the end of the month when the shock occurred, compared with the price 12 months later. Past performance is no guarantee of future results.
2. "February 2026 ISM® Manufacturing PMI® Report," Institute for Supply Management, accessed on March 8, 2026, www.ismworld.org/supply-management-news-and-reports/reports/ism-pmi-reports/pmi/february/.
Past performance is no guarantee of future results.
Investing involves risk, including risk of loss.
Views expressed are as of the date indicated, based on the information available at that time, and may change based on market or other conditions. Unless otherwise noted, the opinions provided are those of the speaker or author and not necessarily those of Fidelity Investments or its affiliates. Fidelity does not assume any duty to update any of the information.
Stock markets are volatile and can fluctuate significantly in response to company, industry, political, regulatory, market, or economic developments. Investing in stock involves risks, including the loss of principal.
In general, the bond market is volatile, and fixed income securities carry interest rate risk. (As interest rates rise, bond prices usually fall, and vice versa. This effect is usually more pronounced for longer-term securities). Fixed income securities also carry inflation risk, liquidity risk, call risk and credit and default risks for both issuers and counterparties. Lower-quality fixed income securities involve greater risk of default or price changes due to potential changes in the credit quality of the issuer. Foreign investments involve greater risks than U.S. investments, and can decline significantly in response to adverse issuer, political, regulatory, market, and economic risks. Any fixed-income security sold or redeemed prior to maturity may be subject to loss.
The technology industries can be significantly affected by obsolescence of existing technology, short product cycles, falling prices and profits, competition from new market entrants, and general economic condition.
The energy industries can be significantly affected by fluctuations in energy prices and supply and demand of energy fuels, energy conservation, the success of exploration projects, and tax and other government regulations.
As with all your investments through Fidelity, and in connection with your evaluation of the security, you must make your own determination whether an investment in any particular security or securities is consistent with your investment objectives, risk tolerance, and financial situation. Fidelity is not recommending or endorsing this investment by making it available to its customers.
The S&P 500® Index is a market capitalization-weighted index of 500 common stocks chosen for market size, liquidity, and industry group representation to represent US equity performance.
The VIX is an index that measures expected volatility in the stock market over the next 30 days.
PCE Price Index is a broad U.S. inflation measure that tracks how much consumers pay for goods and services. It’s the Federal Reserve’s preferred gauge of inflation.
PMI is a monthly survey of business conditions. A reading above 50 signals economic expansion; below 50 signals contraction.
Fidelity Investments® provides investment products through Fidelity Distributors Company LLC; clearing, custody, or other brokerage services through National Financial Services LLC or Fidelity Brokerage Services LLC; and institutional advisory services through Fidelity Institutional Wealth Adviser LLC.
Fidelity Institutional Asset Management (FIAM) includes the following entities that provide investment services: Fidelity Institutional Asset Management Trust Company, a New Hampshire trust company (FIAM TC), and FIAM LLC, a U.S. registered investment adviser. Fidelity Asset Management Solutions (FAMS) includes FIAM and Fidelity Diversifying Solutions LLC (FDS), a U.S. registered investment adviser, commodity pool operator and commodity trading advisor. FAMS provides a broad array of investment solutions with its Global Institutional Solutions (GIS), Global Asset Allocation (GAA), and institutional equity, fixed income, high income, and alternative asset management teams through FIAM LLC, FIAM TC and FDS.